목차
Title page
Contents
Introduction 7
Methodology 8
Addressing Fragility and Conflict in Financing for Development 9
Challenges and Opportunities for Decarbonization in FCS 11
Climate Risk and Resilience in FCS 14
Breakdown of Climate Change in FCV Settings 16
Drought and Near-Term Climate Change Projections 18
Discussion and Future Directions 24
References 27
Annex 1 28
FIGURE 1. Global FCS Footprint by FCS Category 2006-2023 7
FIGURE 2. Breakdown of IDA and LDC Designated Countries Listed on the FCS List Over Multiple Years, 2006-2023 10
FIGURE 3. Average Annual Per Capita CO₂ Emissions Across FCS Categories, 1950-2023 11
FIGURE 4. Average Total GHG Emissions in FCS Countries, 1950-2023 12
FIGURE 5. Fossil Fuel Subsidies Estimates for FCS and Non-FCS Countries: Total as Share of GDP (2023), Average per Capita (2023), and Average Total Transport Oil Subsidies (2010-2023) 12
FIGURE 6. Countries with NDCs Submitted to the UNFCCC Broken Down by FCS Category 13
FIGURE 7. Impacts of Climate-Related Disasters by FCS Category: (a) Average Number of Deaths (b) Average Total Economic Damage, 2008-2023 14
FIGURE 8. Displaced Persons Associated with Natural Hazards in FCS Countries, 2008-2023 15
FIGURE 9. Average Number of Internally Displaced People vs Total Number of Climate-Related Disasters by FCS Category, 2008-2023 15
FIGURE 10. Total Violent Conflict Fatalities in FCS Countries, 2016-2023 16
FIGURE 11. Average Change in Number of Conflict Events Between the Lean Season and Other Months Across FCS Categories, 2008-2023 17
FIGURE 12. FCS Countries Average Percentage of Total Crop Area that is Rainfed, 2016-2020 18
FIGURE 13. Average PDSI Probability Density Representations by FCS Category, 2006-2023 19
FIGURE 14. FCS and Non-FCS Countries Regional PDSI Averages, 2006-2023 20
FIGURE 15. Average Climate Water Deficit Probability Density Representations by FCS Category, 2006-2023 21
FIGURE 16. FCS Countries Projected Global Differences in Average Minimum Temperature for RCP Scenario 8.5, 2006-2040 22
FIGURE 17. Projected Difference in Average Minimum Temperature for RCP Scenario 8.5 by FCS Category and Region, 2006-2040 23
FIGURE 18. Average Precipitation Anomalies Against the Difference in Average Minimum Temperature for Projections under RCP Scenario 8.5 by FCS Category, 2006-2040 23
Annex Figures
FIGURE A.1. Classification Tree for Assigning Economies to the World Bank List of Fragile and Conflict-Affected Situations 28
해시태그
관련자료
AI 요약·번역 서비스
인공지능이 자동으로 요약·번역한 내용입니다.
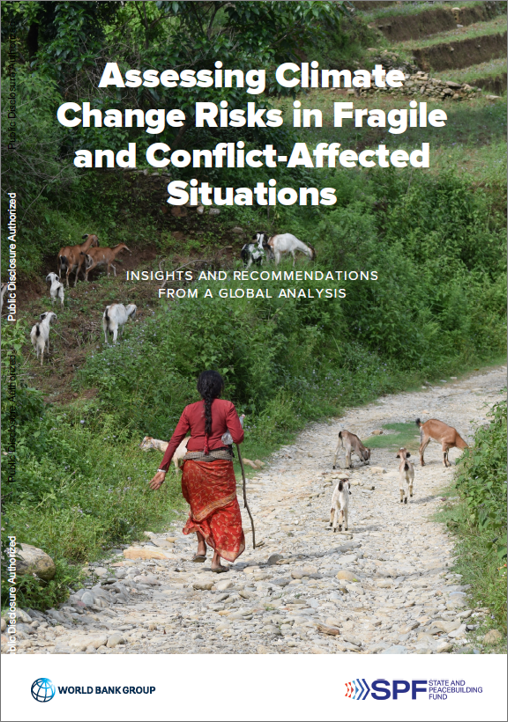
Assessing climate change risks in fragile and conflict-affected situations : insights and recommendations from a global analysis
(취약하고 갈등이 있는 상황에서의 기후 변화 위험 평가 : 글로벌 분석의 통찰력과 권장 사항)


