
- 주제별 국가전략 목록으로 이동
- 주제별 국가전략
- 전체
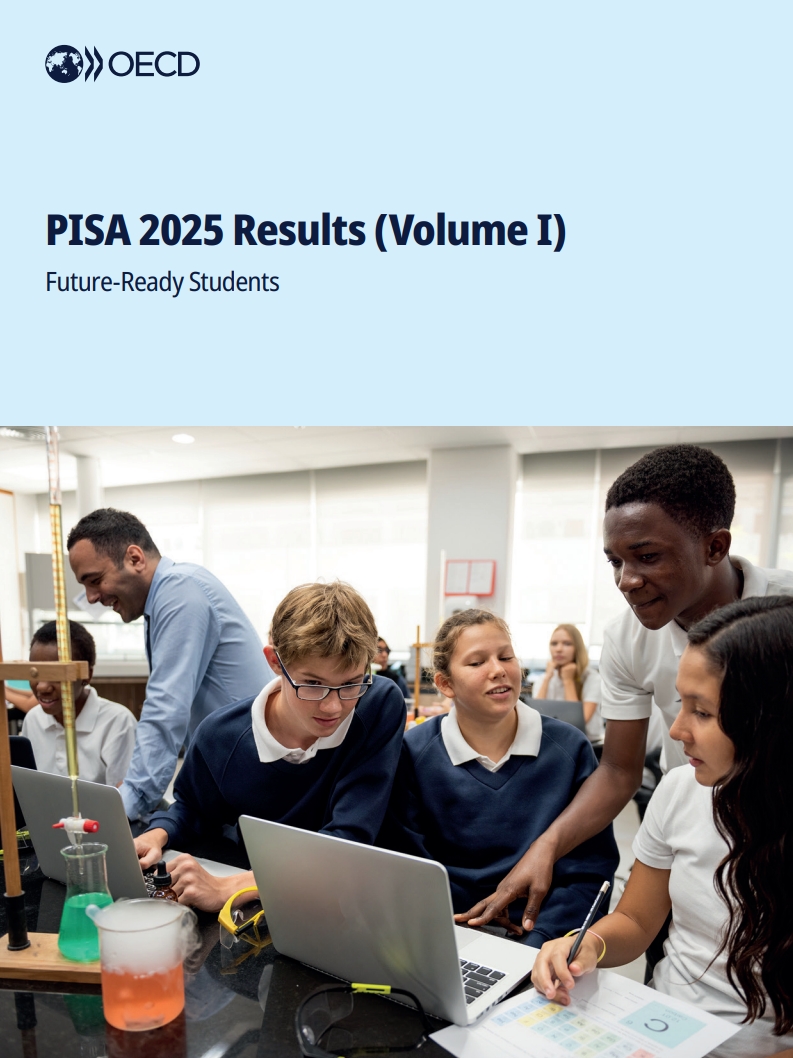
PISA 2025 results. Volume I, Future‑ready students
(PISA 2025 결과 (제1권): 미래를 준비한 학생들)목차
Title page 1
Contents 11
Preface 4
Foreword 6
Acknowledgements 9
Reader's Guide 17
Executive Summary 26
What is PISA? 47
OECD's Programme for International Student Assessment (PISA) 47
What is unique about PISA? 47
Which countries and economies participate in PISA? 47
Key features of PISA 2025 48
References 51
Notes 51
1. Multidimensional student learning in PISA 2025 52
The multidimensional framework for competent learners 53
Competent learners 55
Safe and fair learning environments 63
Supportive families and schools 63
Student engagement in environmental challenges 64
References 67
Notes 67
2. Student performance in PISA 2025 69
Performance in science, reading, mathematics and computational problem solving 71
Changes in performance across cycles 90
Equity in education in PISA 2025 109
References 145
Notes 148
3. Student attitudes towards learning 151
Curiosity and perseverance 156
Growth mindset, beliefs about the nature of science and cognitive adaptability 163
Student agency: Self-regulated help seeking and goal setting 179
Sense of belonging and the value of school for students 190
Student engagement with learning and performance in science 206
References 213
Notes 216
4. Student school life and beyond 218
Introduction 221
School resources 222
Relationships with teachers and families 251
School climate 260
References 274
Notes 276
5. Students and the environment 281
Introduction 283
Student proficiency in environmental science in PISA 2025z 284
Environmental attitudes as reported in PISA 2025 288
Environmental commitment 294
Environmental proficiency, attitudes and commitment 300
School opportunities for environmental learning and action 303
References 307
Notes 308
Annex A1. Trends in reading scores over three PISA cycles (2018-2025) 309
Annex A2. The PISA target population and the PISA samples 322
Annex A3. Technical notes on analyses in this volume 327
Annex B1. Results for countries and economies 333
Annex B2. Results for regions within countries 345
Annex C. Released items from the PISA 2025 Science and Learning in the Digital World (LDW) assessments 347
Annex D. Overview of performance trends 360
Annex E. The development and implementation of PISA: A collaborative effort 361
Table I.1. Snapshot of performance in science, reading, mathematics and computational problem-solving 29
Table I.2. Snapshot of socio-economic disparities and immigrant background in science performance 31
Table I.3. Snapshot of gender gaps in performance 33
Table I.4. Snapshot of perceived engagement with learning and response behaviour 35
Table I.5. Snapshot of safe and fair learning environment 37
Table I.6. Snapshot of digitalisation and Artificial Intelligence (AI) 39
Table I.7. Snapshot of supportive families and schools 41
Table I.8. Snapshot of students and the environment 43
Table 1. PISA 2025 participating countries and economies 48
Table I.1.1. PISA 2025 figures in Chapter 1 66
Table I.2.1. Comparing countries' and economies' performance in science 72
Table I.2.2. Description of the aggregated levels of science proficiency in PISA 2025 78
Table I.2.3. Comparing countries and economies on the science competency subscales 82
Table I.2.4. Comparing countries' and economies' performance in computational problem solving 85
Table I.2.5. Within-country correlation across domains in PISA 2025 87
Table I.2.6. Change between 2022 and 2025 in mean performance in science, reading and mathematics 90
Table I.2.7. Yearly learning gain in PISA scores in ten countries and economies 92
Table I.2.8. Change between 2022 and 2025 in low- and top performers in science 95
Table I.2.9. Trends in mean performance in science, reading and mathematics since 2015 102
Table I.2.10. Change between 2022 and 2025 in the socio-economic gap in science performance 121
Table I.2.11. Change between 2022 and 2025 in low and top performers in science, by national quarter of socio-economic status 128
Table I.2.12. Change between 2022 and 2025 in mean performance in science, by gender 132
Table I.2.13. Change between 2022 and 2025 in low- and top performers in science, by gender 138
Table I.2.14. PISA 2025 figures and tables in Chapter 2 144
Table I.3.1. Summary of relationships across the student attitudes measured in PISA 2025 153
Table I.3.2. Description of the scientific profiles 174
Table I.3.3. Change in student attitudes, over one year of schooling and age, in eight countries and economies 201
Table I.3.4. Summary of findings across the dimensions of student engagement 210
Table I.3.5. PISA 2025 figures and tables in Chapter 3 212
Table I.4.1. School resources, relationships with teachers and families, school climate, students' science performance and attitudes... 222
Table I.4.2. Shortage of digital devices and student science performance 225
Table I.4.3. School policies on the use of digital devices and student science performance 237
Table I.4.4. PISA 2025 figures and tables in Chapter 4 273
Table I.5.1. Students' environmental awareness, by topic 289
Table I.5.2. Belief in collective environmental efficacy, by topic 291
Table I.5.3. PISA 2025 figures and tables in Chapter 5 307
Figure I.1.1. PISA 2025's multidimensional framework for competent learners 53
Figure I.1.2. Multiple dimensions of student learning 54
Figure I.1.3. Science performance and spending on education 56
Figure I.1.4. The global pool of future science innovators across 91 countries and economies 57
Figure I.1.5. Trends in performance over time in science, reading and mathematics 58
Figure I.1.6. Trends in low- and high-achievers over time in science, reading and mathematics 58
Figure I.1.7. Trends in student perceived engagement over time 59
Figure I.1.8. Competent, proficient and engaged learners 60
Figure I.1.9. Engaged learners and proficient learners 61
Figure I.1.10. Trends in engagement and trends in performance 62
Figure I.1.11. Multiple dimensions of student engagement in environmental challenges 64
Figure I.1.12. Social mobility, growth mindset and academic resilience 66
Figure I.2.1. Distribution of science performance 75
Figure I.2.2. Variation in science performance between and within schools 76
Figure I.2.3. Students' proficiency in science 80
Figure I.2.4. Relative performance in computational problem solving 89
Figure I.2.5. Average change in science scores for low- and high-achieving students (2022-2025) 93
Figure I.2.6. Trends in performance over time in science, reading and mathematics 96
Figure I.2.7. Average decennial trend in science for low- and high-achieving students (2015-2025) 103
Figure I.2.8. Linear trend in the minimum score attained by at least 25% of 15-year-olds since 2015 106
Figure I.2.9. Performance change in literacy from age 15 to young adulthood 108
Figure I.2.10. Strength of the socio-economic gradient and share of 15-year-olds at or above proficiency Level 2 in science 111
Figure I.2.11. Overlap of low performers in science, reading and mathematics among all 15-year-olds 114
Figure I.2.12. Performance in science, by national quarters of socio-economic status 117
Figure I.2.13. Performance in science, by international quarters of socio-economic status 118
Figure I.2.14. Change between 2022 and 2025 in science performance, by quarter of socio-economic status 120
Figure I.2.15. Low performers in science, by socio-economic status 123
Figure I.2.16. Academically resilient students in science 124
Figure I.2.17. Students' deprivation 126
Figure I.2.18. Gender gap in science performance 131
Figure I.2.19. Low performers in science, by gender 135
Figure I.2.20. Top performers in science, by gender 136
Figure I.2.21. Disadvantaged students, by immigrant background 141
Figure I.2.22. Immigrant students who do not speak the language of assessment at home 142
Figure I.2.23. Differences in science performance, by immigrant background 143
Figure I.3.1. Mean country-level results for selected dimensions 154
Figure I.3.2. Change in students who disagree that learning new things is boring between PISA 2022 and PISA 2025 157
Figure I.3.3. Change in students who feel more curious than most people they know between PISA 2022 and PISA 2025 158
Figure I.3.4. Change in students who apply additional effort when work becomes challenging between PISA 2022 and PISA 2025 160
Figure I.3.5. Change in giving up easily and change in finding learning new things boring between 2022 and 2025 161
Figure I.3.6. Students who like learning new things, by level of students' perseverance 162
Figure I.3.7. Students with a growth mindset, by gender 164
Figure I.3.8. Students with a growth mindset and who like learning new things 165
Figure I.3.9. Students with a growth mindset and who apply additional effort when work becomes challenging 167
Figure I.3.10. Teachers' and students' growth mindset 168
Figure I.3.11. Growth mindset and encouragement for students to persevere 169
Figure I.3.12. Students checking reliability of sources 171
Figure I.3.13. Students' curiosity and beliefs about the nature of science 172
Figure I.3.14. Percentage of students with strong scientific and non-restrictive profiles, and average science performance 175
Figure I.3.15. Students' cognitive adaptability, by gender 177
Figure I.3.16. Students' perseverance and cognitive adaptability 178
Figure I.3.17. Students' help seeking, by gender 180
Figure I.3.18. Students who like learning new things, by level of students' self-regulated help seeking 181
Figure I.3.19. Students who only ask for help after trying hard to find the solution on their own, by fixed and growth mindset 183
Figure I.3.20. Students' goal setting, by gender 185
Figure I.3.21. Students who like to learn new things, by self-regulated goal setting 186
Figure I.3.22. Relationship between students' curiosity and goal setting, by teacher support 187
Figure I.3.23. Cognitive activation in science classes and students' attitudes toward learning and science 189
Figure I.3.24. Sense of belonging at school, by gender 191
Figure I.3.25. Students who believe school has taught them things useful in a job, by level of students' sense of belonging 193
Figure I.3.26. Students who apply additional effort when work becomes challenging, by level of students' sense of belonging 194
Figure I.3.27. Relationship between students' curiosity and sense of belonging, by level of teacher support 195
Figure I.3.28. Change in students who disagree that school has done little to prepare them for adult life between PISA 2022 and PISA 2025 198
Figure I.3.29. Students with a growth mindset and who believe that school prepares them for adult life 199
Figure I.3.30. Percentage of students who believe that school prepares them for adult life, by proficiency level in science 203
Figure I.3.31. Students who believe that school prepares them for adult life, by level of students' curiosity 204
Figure I.3.32. Dimensions of engagement, by proficiency level in science 205
Figure I.3.33. Relationship between curiosity and science performance 207
Figure I.3.34. Relationship between perseverance and science performance 208
Figure I.4.1. Shortage of digital devices 224
Figure I.4.2. School capacity to enhance teaching and learning using digital devices: 2018 through 2025 226
Figure I.4.3. Change between 2022 and 2025 in time spent per day using digital devices at school 228
Figure I.4.4. Change between 2022 and 2025 in time spent on leisure activities 229
Figure I.4.5. Time spent on digital devices for learning at school per day and science performance 230
Figure I.4.6. Time spent on digital devices for leisure at school per day and science performance 231
Figure I.4.7. Distraction from digital devices in science lessons 232
Figure I.4.8. Distraction from digital devices and science performance 233
Figure I.4.9. Digital distraction and frequency of use of digital devices in science lessons 234
Figure I.4.10. Digital distraction and school policies on the use of digital devices 236
Figure I.4.11. Students' use of artificial intelligence chatbots for schoolwork 238
Figure I.4.12. Students' non-use of artificial intelligence for schoolwork 239
Figure I.4.13. Mean score in science, by frequency of AI use for schoolwork 240
Figure I.4.14. Mean score in science, by frequency of AI use "to help me learn" and frequency of assessing AI-generated information... 241
Figure I.4.15. Help seeking, by frequency of AI use for schoolwork 242
Figure I.4.16. Curiosity, by frequency of AI use for schoolwork 243
Figure I.4.17. Overall level of use of artificial intelligence for schoolwork and mean performance in science 244
Figure I.4.18. Changes between 2022 and 2025 in shortages of teaching staff 246
Figure I.4.19. Shortage of education staff and material resources, and science performance 247
Figure I.4.20. Total time spent on homework (all subjects) and science performance 249
Figure I.4.21. Study help provision in schools 250
Figure I.4.22. Change between 2015 and 2025 in reported teacher support in science 252
Figure I.4.23. Teacher support in science and science performance 253
Figure I.4.24. Socio-economic gap in higher education aspirations and parental and peer aspirations 255
Figure I.4.25. Family support and science performance 256
Figure I.4.26. Change between 2022 and 2025 in family support 257
Figure I.4.27. Students' educational and occupational expectations 259
Figure I.4.28. Change between 2015 and 2025 in disciplinary climate and in science performance 261
Figure I.4.29. Students' exposure to bullying 262
Figure I.4.30. Students' exposure to cyberbullying, by student and school characteristics 265
Figure I.4.31. Students' exposure to bullying and science performance 267
Figure I.4.32. Cyberbullying and time spent using digital devices 268
Figure I.4.33. Exposure to bullying and the school learning environment, at the school level 269
Figure I.4.34. Change between 2018 and 2025 in truancy and lateness 270
Figure I.4.35. Truancy and science performance 272
Figure I.5.1. Student environmental agency, as examined in PISA 2025 284
Figure I.5.2. Mean score in student performance on environmental science (science subscale) 285
Figure I.5.3. Disparities in environmental science (science subscale), by student and school characteristics 286
Figure I.5.4. Student proficiency in environmental science (science subscale) 287
Figure I.5.5. Students' beliefs in their capacity to generate environmental change, by topic 290
Figure I.5.6. Pro-environmental attitudes and student performance in environmental science 292
Figure I.5.7. Mismatch between proficiency in environmental science and caring for the environment 293
Figure I.5.8. Students' participation in environment-related activities, by student and school characteristics 295
Figure I.5.9. Reasons for never participating in environmental activities 297
Figure I.5.10. Environment-related career expectations, by student characteristics 299
Figure I.5.11. Environmental proficiency, attitudes and long-term commitment, by short-term commitment 301
Figure I.5.12. Mismatch between care for the environment and environmental commitment 302
Figure I.5.13. Opportunities for environmental learning in class, by type 304
Figure I.5.14. Opportunities for environmental learning in class, by country/economy 305
Figure I.5.15. Environmental learning opportunities and three dimensions of environmental agency 306
Boxes 16
Box 1. Interpreting differences in PISA scores 24
Box I.1.1. Students' perceptions of social mobility 65
Box I.2.1. Comparing countries and economies on the three science competency subscales 81
Box I.2.2. How much do 15-year-olds learn over one year of schooling? 91
Box I.2.3. Why has reading performance declined over time? Four underlying forces 96
Box I.2.4. Do literacy skills continue to develop after age 15? Evidence from PISA and PIAAC 107
Box I.2.5. Multidimensional deprivation among students participating in PISA 125
Box I.3.1. Growth mindset and teacher and family support 168
Box I.3.2. Views on fact-checking information versus relying on common sense 173
Box I.3.3. Students' enjoyment of science and cognitive activation in science classes 189
Box I.3.4. How do student attitudes towards schooling and learning change during adolescence? 200
Box I.4.1. Leisure time on digital devices has declined outside of school 228
Box I.4.2. Assessing AI-generated information as a learning opportunity 241
Box I.4.3. How do parental and peer expectations shape higher education aspirations? 254
Box I.4.4. Inter-generational transmission of occupation and education 258
Box I.5.1. Environmental literacy in PISA: Key concepts and measures 284
Box I.5.2. Caring without proficiency or proficiency without caring 292
Infographics 14
Infographic 1. PISA 2025 key results 45
Table I.A1.1. Trends in reading scores over three PISA cycles (2018-2025) - Tables for Annex A1 319
Table I.A2.1. The PISA target population and the PISA samples - Tables for Annex A2 324
Table I.A3.1. Link errors for the linear trend between previous assessments and PISA 2025 332
Table I.B1.1. How did countries perform in PISA 2025? Chapter 1 tables 333
Table I.B1.2. Student performance in PISA 2025. Chapter 2 tables - Performance and proficiency 333
Table I.B1.3. Student performance in PISA 2025. Chapter 2 tables - Socio-economic differences 334
Table I.B1.4. Student performance in PISA 2025. Chapter 2 tables - Gender differences 335
Table I.B1.5. Student performance in PISA 2025. Chapter 2 tables - Immigrant background 336
Table I.B1.6. Student attitudes towards learning. Chapter 3 tables 336
Table I.B1.7. Student school life and beyond. Chapter 4 tables 338
Table I.B1.8. Students and the environment. Chapter 5 tables 343
Table I.B2.1. Results for regions within countries - Annex B2 tables 345
Table I.D.1. Overviews of performance trends by country and economy 360
해시태그
관련자료


AI 요약·번역·분석 서비스
AI를 활용한 보고서 요약·번역과 실시간 질의응답 서비스입니다.
PISA 2025 results. Volume I, Future‑ready students
(PISA 2025 결과 (제1권): 미래를 준비한 학생들)
국가전략포털에서 실시간 AI 질의응답 서비스를 시작합니다. 4가지 유형의 요약과 번역을 이용해보시고, 보고서에 대해 추가로 알고 싶은 내용이 있으면 채팅창을 통해 자유롭게 AI에게 물어볼 수 있습니다.
※ 제공하는 정보는 참고용이며, 정확한 사실 확인이 필요할 수 있습니다. 민감한 개인정보는 입력하지 마십시오.